DiXi Group presents updated Energy Map open data service
According to data by the Better Regulation Delivery Office, up to 5 million Ukrainians use open data-based services every month
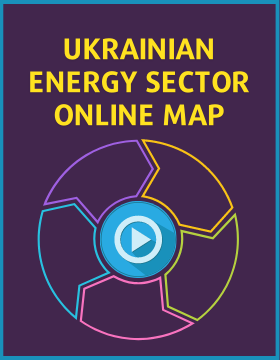
DiXi Group presented an updated version of the Energy Map open data service. All data offered there is immediately available in a convenient machine-readable format and comes with a description of the nature of information, DiXi Group expert Roman Nitsovych said during the online presentation of this service.
“Our team has launched this service back in July 2017, but now, we are rebooting it in a completely revamped version even more convenient to use. The Energy Map is a platform with the largest database of official information concerning all sections of the Ukrainian energy sector. It’s a real navigator in the energy coordinate system, where you can quickly find the data and statistics you need. The Energy Map allows to save time on gathering information and go straight to decision making,” Mr. Nitsovych said.
Open data and convenient access to it are a factor that helps fight corruption and has a powerful social impact.
“According to data by the Better Regulation Delivery Office, up to 5 million Ukrainians use open data-based services every month. And Kyiv School of Economics estimates that by 2025, the aggregate contribution of open data to economic development should reach US 1.4 billion, or almost 1% of GDP. The job we do is a part of the general movement toward development of this area,” Mr. Nitsovych pointed out.
According to DiXi Group Open Data Manager Andrii Bilous, his think tank uses open data every day in various projects.
“We constantly need official statistical data. And every time, the problems are the same: this data is hard to find. Even worse, this data could be hard to use. The majority of public authorities have these problems,” the expert stressed.
The Energy Map is designed to fix these problems: the entire data is already gathered in one place. Presently, the service contains over 300 unique tables.
“You will also receive complete and exhaustive information about this data. You can select data in a convenient format or right with English translation, and won’t need to waste time on cleaning up or supplementing data,” Mr. Bilous added.
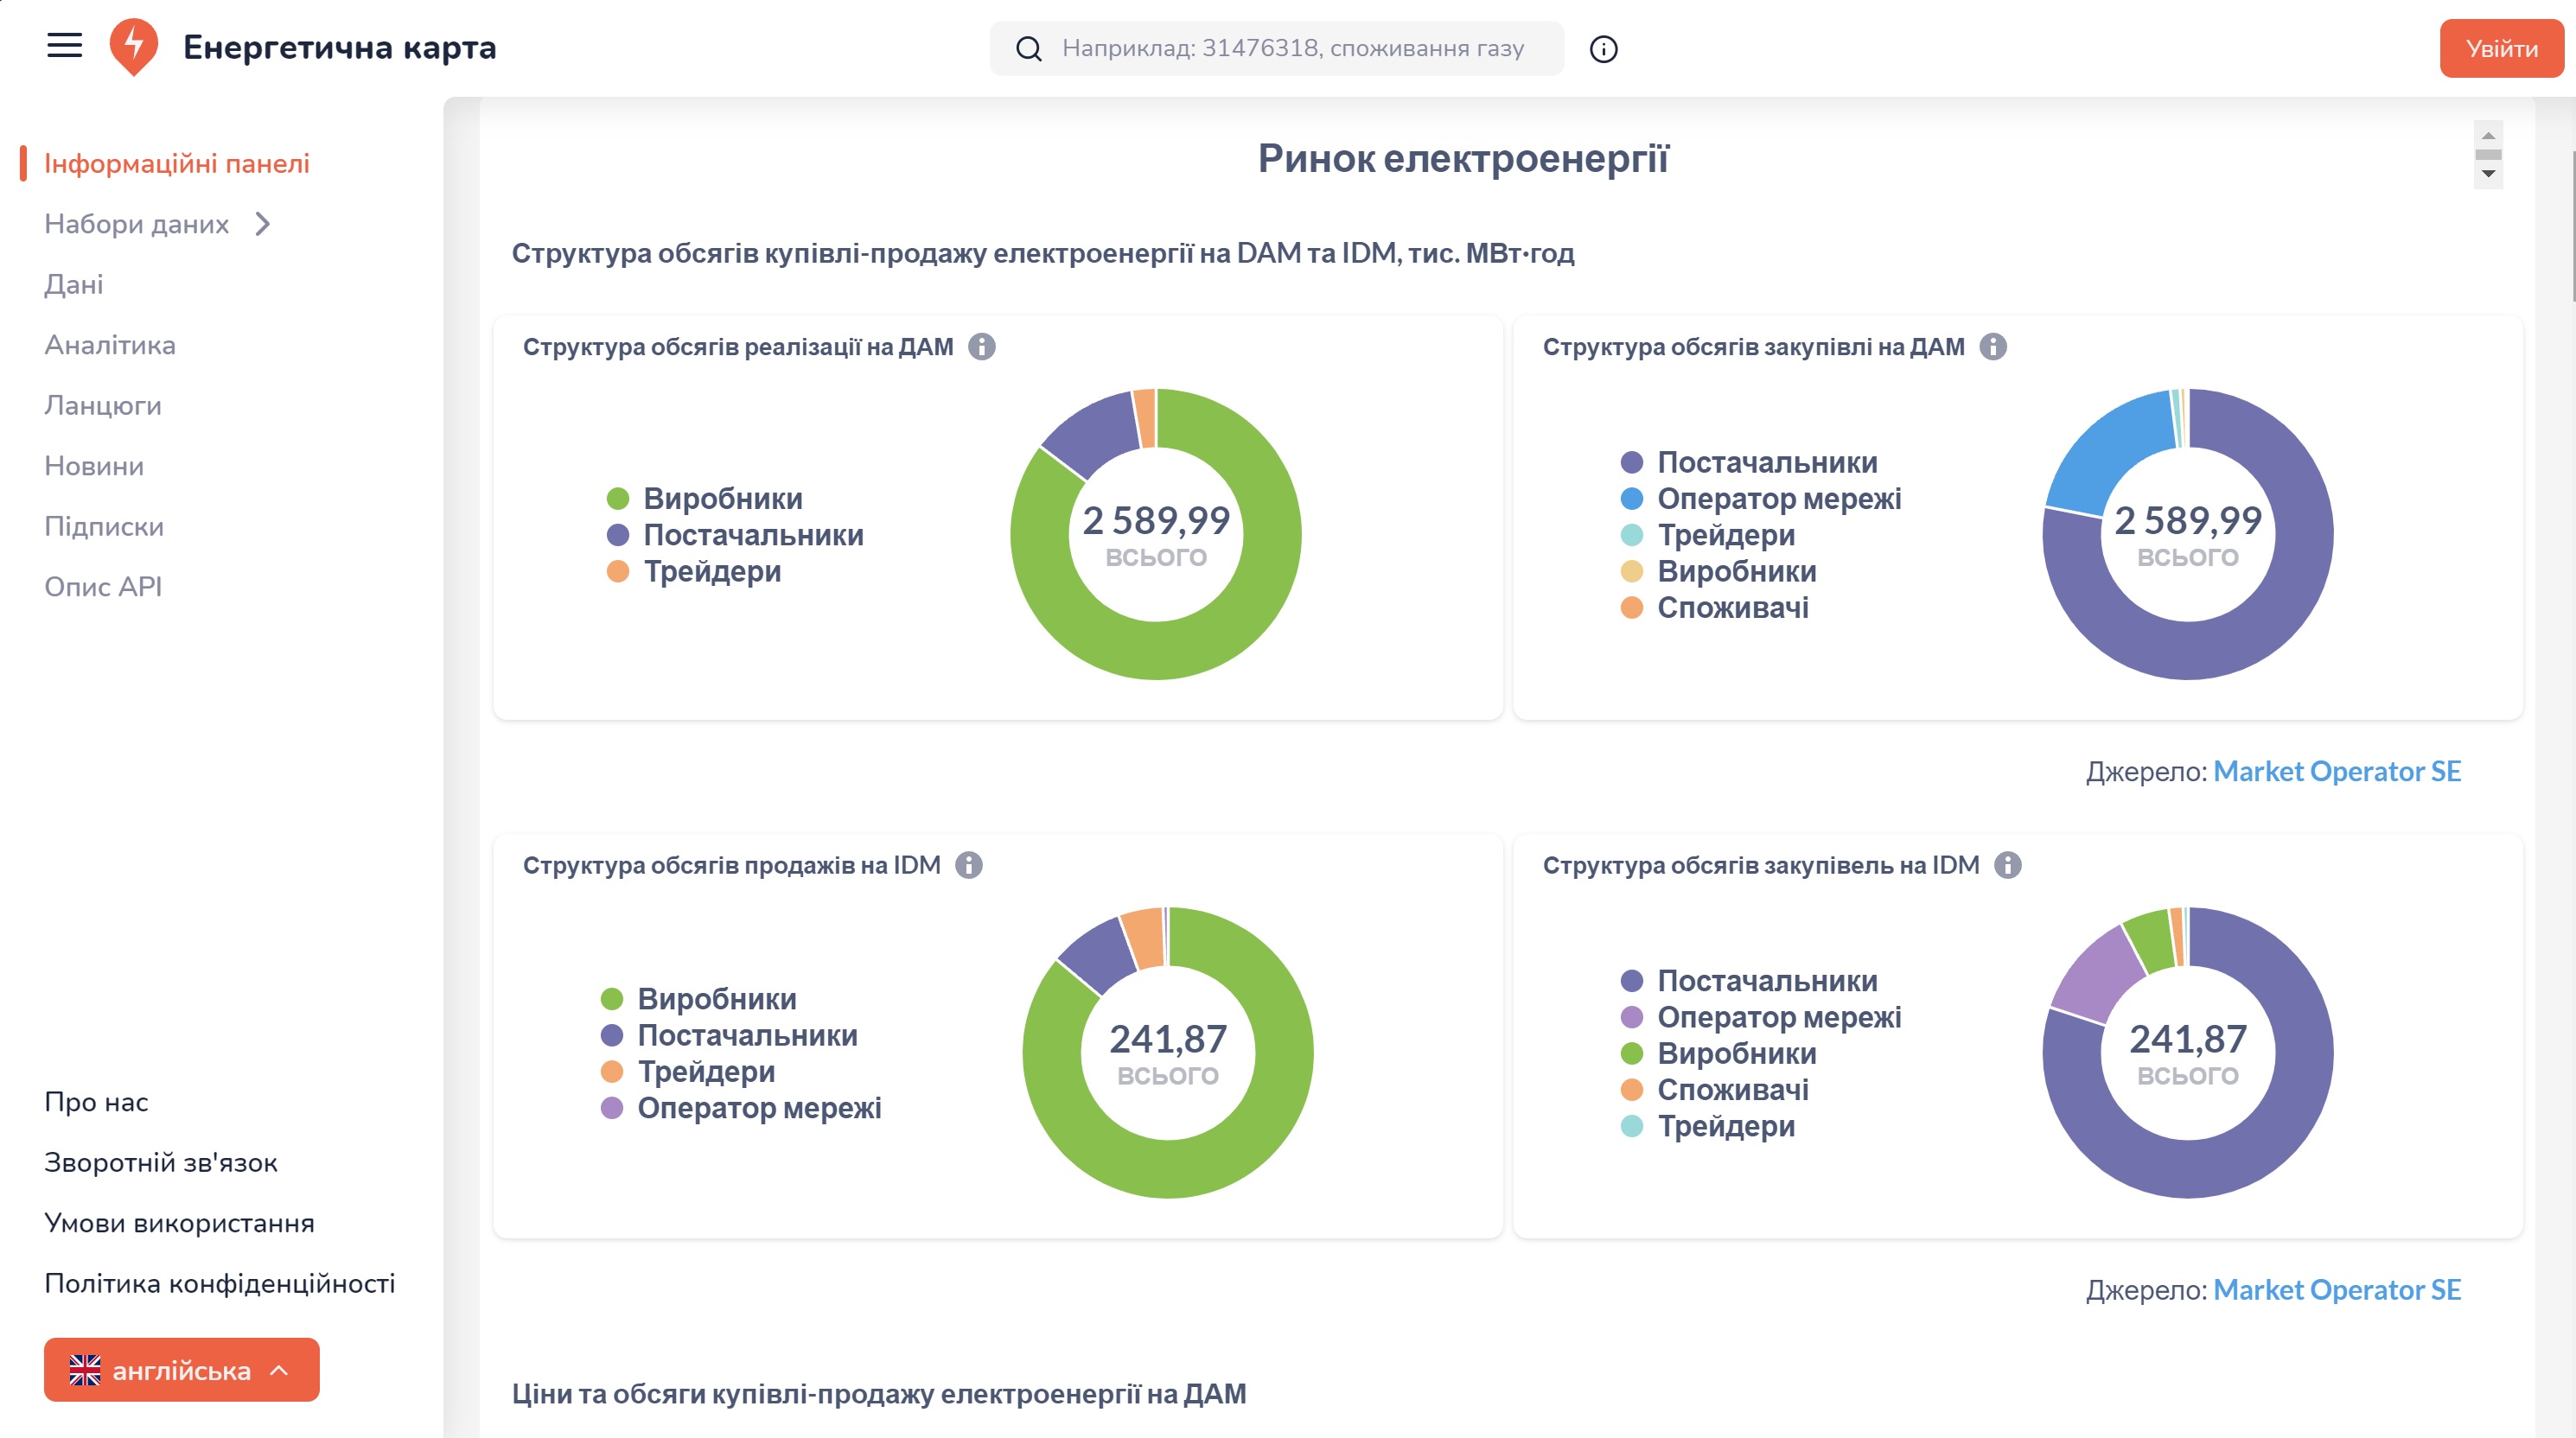
The Energy Map is a unique portal you can use to quickly find up-to-date statistics, including market data.
Major features of the Energy Map:
- all data located in one, easy-to-navigate place;
- an analytical panel showing dynamics of key indicators;
- search of company stats by EDRPOU code;
- full English-language localization;
- interactive learning schemes about operation of the energy sector.