Mysteries of the gas distribution bill
How much oblgaz companies pay for gas they buy for their own needs and how it bears upon the tariff: we studied the costs of production and technological losses (PTL)
The subject of natural gas distribution tariffs remains in the epicenter of discussions concerning the energy sector. The opinions concerning economic rationale for the “delivery charge” are often directly the opposite. Since recently, the gas distribution charge has been made into a separate gas bill, and the amounts due stated in it raised many questions among ordinary Ukrainians.
Gas distribution system operators (gas-DSOs) maintain that the distribution tariffs do not cover all their costs of operating these networks and cause them incur debts. According to information available on the Open Data Portal, the aggregate financial result of oblgaz companies in 2020 was a loss of UAH 2.79 billion (only eight of these companies were profitable).
On the other hand, public authorities point out the inefficient use of tariff revenues by operators.
We took a look from two angles at one of the largest expense items of oblgaz companies: procurement of natural gas for various technological processes of delivering gas to end consumers. One is the volume of this gas per se: how rational this volume is. The other is price, or rather, whether or not the procurements of this gas are overpriced.
After a detailed analysis of NEURC resolutions and reports on inspection of certain oblgaz companies, we found examples of nontransparent, noncompetitive and overpriced, in our opinion, procurements of gas to cover technological losses. At the same time, the prices for procurement of PTL gas, included by the energy regulator in the distribution tariff, look obviously too low. As a result, we have a “price gap” that translates into multimillion debts of oblgaz companies and “tariff protests”.
What is PTL?
No element of the gas transmission or a gas distribution system is completely airtight. Therefore, a portion of gas gets lost, which is called a technological loss of gas. The volume of loss depends to the largest degree on the length and diameter of pipelines, equipment type and service life, pressure in the system, and other factors.
At the same time, there are certain technological processes used to deliver gas to end consumers; these processes also consume gas, which means that gas is spent for this purpose as well. They include, for example, injection of gas into new or reconstructed networks, setting up equipment (for example, gas pressure regulating stations) for the required operation mode, technological heating of gas at gas pressure regulating stations, and other.
The aggregate volume of “lost” and “spent” natural gas is marked as PTL. The existence of PTL in networks due to various production and technological factors is an unalienable part of uninterruptible gas supply to consumers.
What does the PTL volume depend on?
The amount of gas delivery tariff, payable by end consumers, is calculated based on the gas delivery costs and the consumption volume: the higher the costs are with the unvarying consumption, the higher the tariff will be. And vice versa: a higher consumption volume means lower distribution tariff with the unvarying costs.
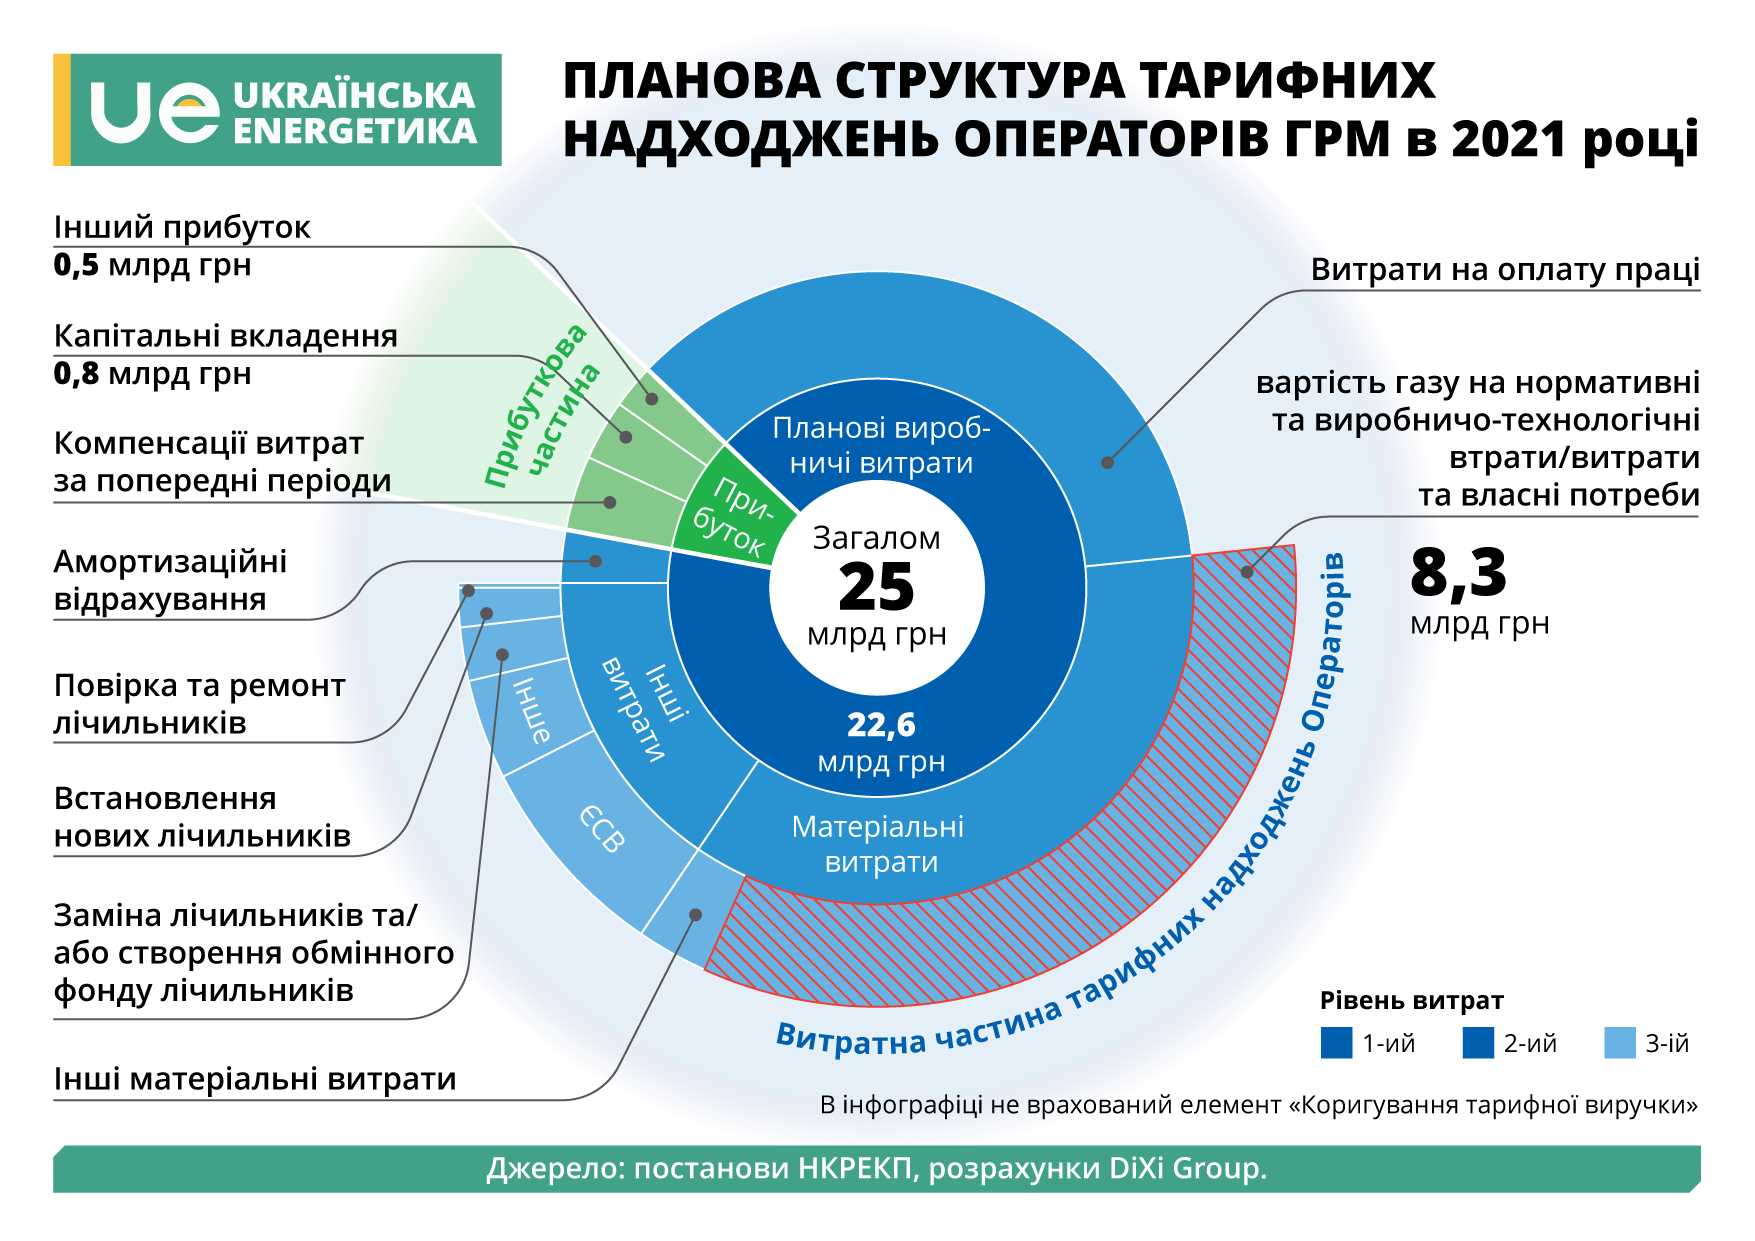
A look at the structure of costs of gas distribution system operators reveals that it is basically the same for any company: labor costs, depreciation, taxes. PTL costs are one of its components, too.
For all oblgaz companies on aggregate, the share of PTL is quite substantial, amounting to approximately one-third. Therefore, optimization of this expense item would allow the NEURC to regulate activity of oblgaz companies with greater flexibility, in particular, finance investments in networks via the tariff or reduce the tariff burden. Inter alia, it could be one of the instruments of reducing the debts owed by oblgaz companies to Gas Transmission System Operator.
In the end, PTL costs in monetary terms boil down to the direct dependence on gas volume and the price at which an operator buys gas for these needs. Therefore, the rationale for PTL costs could be considered based on two factors.
“PTL cost” = “PTL volume” × “Natural gas price”
Obviously, PTL costs could be reduced by minimizing the volumes of gas lost and spent in networks, or by procuring the necessary volumes of gas at lower prices, or by doing both at once.
Who rationalizes PTL volumes?
PTL volumes are obtained by estimation, because measuring the actual volumes of lost and spent gas for every element and facility of a gas distribution network is quite problematic. Estimates are based on the approved norms according to the NEURC’s new methodology. PTL volumes are calculated by oblgaz companies themselves based on normative losses in the entire equipment and the expected gas spending volumes. After that, these calculations are submitted to the regulatory authority for approval.
According to Vinnytsiagaz Chief Financial Officer Serhii Kibitlevskyi, prior to 2016 the PTL volumes for gas-DSOs were approved by the Energy Ministry, and up until the end of 2020 there was a legal vacuum in this area. The powers to determine PTL were vested in the regulator only five years later, and before that, obsolete PTL norms remained in effect, haven’t been updated since 2015.
Overall, representatives of three gas-DSOs (Mykolaivgaz, Zakarpatgaz and Vinnytsiagaz) were positive about the new Methodology, pointing out a number of innovations it introduced. They include, in particular, accommodation of metrological losses and a separate calculation of PTL for polyethylene gas pipes and cabinet-type gas pressure regulating stations.
In the opinion of the surveyed gas-DSOs, these changes will provide an instrument of controlling the effectiveness of investments in the gas distribution system and stimulate investments in advanced materials and elements of gas distribution systems. At the same time, the inclusion to the total PTL of losses from bringing gas to standard conditions is controversial. For in this case, the costs of covering these losses will be equally disbursed among all consumers, whereas these losses from bringing gas to standard conditions are different in different consumers.
At the same time, Zakarpatgaz Chief Technology Officer Serhii Kozar admits that calculation of PTL volumes is a complex process, in which many factors must be taken into account.
“The volumes of technological gas losses depend on a large number of factors: volumes of distributed gas, distribution modes, weather conditions, number of accidents and other,” Serhii Kozar says.
The only information available for public access concerns the length of networks and planned gas distribution and PTL volumes for gas distribution system operators. Obviously, these indicators are not enough to assess the rationale for PTL volumes. To make this assessment, we need, in particular, a detailed audit of the condition of gas distribution networks, on which experts insist.
Underpriced gas for PTL
In late 2020, the regulatory authority approved the tariffs (source: Energy Map) for natural gas distribution services for 42 oblgaz companies, which reflect the structure of their expenses and profits. This structure also accommodates the costs of procuring gas for PTL purpose, which for all oblgaz companies in general amount to 33% of their total tariff revenue.
An important factor is the gas price included in PTL costs. As follows from the table below, the cost of one thousand cubic meters of gas, set by the regulator, varies between 5800 and 6100 hryvnias.
Gas price and PTL costs
|
Oblgaz company |
PTL costs in the structure of distribution tariff for 2021, UAH |
PTL norms set by NEURC for 2021, thousand m³ |
PTL gas procurement price included in tariff expenses, UAH per thousand m³ |
|
Shepetivkagaz PrJSC |
10 498 800,00 |
1 695 |
6194 |
|
Donetskoblgaz PJSC |
173 864 800,00 |
28 770 |
6043,3 |
|
Dnipropetrovskgaz JSC |
417 817 900,00 |
69 822 |
5984 |
|
Kyivgaz JSC |
95 620 500,00 |
16 030 |
5965,1 |
|
Kremenchukgaz PrJSC |
41 678 500,00 |
6 998 |
5955,8 |
|
Sumygaz JSC |
213 707 700,00 |
35 993 |
5937,5 |
|
Korostyshivgaz PrJSC |
9 387 000,00 |
1 581 |
5937,4 |
|
Zhytomyrgaz JSC |
264 699 000,00 |
44 612 |
5933,4 |
|
Luhanskgaz JSC |
212 501 100,00 |
35 831 |
5930,6 |
|
Khmelnytskgaz JSC |
306 662 900,00 |
51 721 |
5929,2 |
|
Chernihivgaz JSC |
274 388 400,00 |
46 304 |
5925,8 |
|
Kirovohradgaz OJSC |
154 211 900,00 |
26 026 |
5925,3 |
|
Volyngaz JSC |
196 603 300,00 |
33 184 |
5924,6 |
|
Kharkivgaz JSC |
369 006 300,00 |
62 315 |
5921,6 |
|
Rivnegaz JSC |
197 536 300,00 |
33 377 |
5918,3 |
|
Poltavagaz JSC |
289 959 900,00 |
49 020 |
5915,1 |
|
Vinnytsiagaz PJSC |
366 221 700,00 |
61 993 |
5907,5 |
|
Cherkasygaz JSC |
259 334 600,00 |
43 905 |
5906,7 |
|
Kremenets GSSD SE |
8 847 000,00 |
1 498 |
5905,9 |
|
Mariupolgaz PJSC |
66 063 500,00 |
11 189 |
5904,3 |
|
Hadiachgaz PrJSC |
16 121 700,00 |
2 731 |
5903,2 |
|
Kharkivmiskgaz JSC |
142 057 300,00 |
24 069 |
5902,1 |
|
Mykolaivgaz JSC |
229 697 300,00 |
38 944 |
5898,1 |
|
Zaporizhgaz JSC |
238 893 500,00 |
40 508 |
5897,4 |
|
Melitopolgaz PrJSC |
46 270 600,00 |
7 854 |
5891,3 |
|
Lvivgaz JSC |
703 910 900,00 |
119 488 |
5891,1 |
|
Odesagaz JSC |
351 183 200,00 |
59 617 |
5890,7 |
|
Ivano-Frankivskgaz JSC |
333 040 500,00 |
56 540 |
5890,4 |
|
Lubnygaz PJSC |
62 799 700,00 |
10 663 |
5889,5 |
|
Kryvorizhgaz JSC |
102 930 800,00 |
17 479 |
5888,8 |
|
Dniprogaz JSC |
179 865 600,00 |
30 578 |
5882,2 |
|
Kyivoblgaz JSC |
850 999 500,00 |
144 700 |
5881,1 |
|
Tysmenytsiagaz JSC |
25 820 900,00 |
4 391 |
5880,4 |
|
Chernivtsigaz JSC |
266 300 800,00 |
45 290 |
5879,9 |
|
Ternopilgaz PrJSC |
210 960 800,00 |
35 878 |
5879,9 |
|
Khersongaz JSC |
192 452 700,00 |
32 754 |
5875,7 |
|
Umangaz PrJSC |
54 171 000,00 |
9 223 |
5873,5 |
|
Zakarpatgaz JSC |
286 339 700,00 |
48 860 |
5860,4 |
|
Ternopilmiskgaz PrJSC |
80 979 600,00 |
13 831 |
5854,9 |
|
Sirka NRMCE PrJSC |
46 800,00 |
8 |
5850 |
|
Gazovyk LLC |
4 282 200,00 |
732 |
5850 |
In the opinion of Naftogazbudinformatyka LLC CEO Leonid Unigovskyi, these prices aren’t conformant with market level.
“The PTL gas procurement prices set into the distribution tariffs aren’t viable, because the market price at which gas-DSOs must buy gas is much higher,” he says.
At the same time, there is a mechanism of compensating oblgaz companies the nonconformity between actual and planned expenses: the regulator “reimburses” post factum these overpayments via a separate expense item: “Compensation of expenses in past periods”.
As we know from the available information, this approach was used every time the distribution tariff was revised. In the 2021 tariff the amount of this compensation for all oblgaz companies is UAH 991 million, or 4% of the aggregate expenses.
The compensation mechanism as such is fair, and it’s quite obvious why: one cannot precisely forecast gas prices for a year ahead, Leonid Unigovskyi points out.
“I consider the inclusion of “Compensation of expenses in past periods” item reasonable,” Leonid Unigovskyi says. “If, for example, gas-DSOs buy gas for PTL at the prices higher than set into the tariff, they must receive compensation the next year. It’s one of the points where gas-DSOs must receive compensation.”
But whether the actual PTL gas procurement prices are indeed conformant with the market prices effective at that time is a quite different matter.
Wholesale gas procurements cost more
In March-April 2021, the NEURC carried out comprehensive inspections of 14 oblgaz companies, and the results of these inspections are available to the public at large. The regulatory agency was interested in the most diverse aspects of activity of gas-DSOs, from the fulfilment of investment programs to the quality of connection services. The matter of PTL costs wasn’t left without attention, either. It is worth noting that according to the NEURC License Register (source: Energy Map), licenses were issued to the total of 42 distribution system operators, which means that not all oblgaz companies were inspected.
An analysis of information contained in the inspection reports has revealed that in most cases, the actual expenses on PTL needs in 2020 exceeded the planned figures. For all inspected oblgaz companies, the aggregate amount of actual expenses exceeded the planned figure by UAH 687 million, or by 32%.
Expenses of oblgaz companies on gas procurements for PTL and own needs in 2020
|
Oblgaz company |
Planned*, thousand UAH |
Actual, thousand UAH |
Difference**, thousand UAH |
Difference, % |
|
Khersongaz |
99 638,10 |
140 050,97 |
40 412,87 |
40,6% |
|
Chernihivgaz |
140 400,50 |
192 575,70 |
52 175,20 |
37,2% |
|
Odesagaz |
194 564,70 |
255 909,40 |
61 344,70 |
31,5% |
|
Mykolaivgaz |
149 296,40 |
243 453,70 |
94 157,30 |
63,1% |
|
Rivnegaz |
136 887,70 |
105 066,60 |
-31 821,10 |
-23,2% |
|
Hadiachgaz |
8 111,10 |
10 819,12 |
2 708,02 |
33,4% |
|
Vinnytsiagaz |
243 435,80 |
277 257,70 |
33 821,90 |
13,9% |
|
Cherkasygaz |
151 135,60 |
156 718,40 |
5 582,80 |
3,7% |
|
Zakarpatgaz |
154 032,55 |
287 074,73 |
133 042,18 |
86,4% |
|
Zhytomyrgaz |
143 550,50 |
171 448,50 |
27 898,00 |
19,4% |
|
Poltavagaz |
170 401,80 |
201 730,65 |
31 328,85 |
18,4% |
|
Kyivoblgaz |
442 386,20 |
650 263,50 |
207 877,30 |
47,0% |
|
Khmelnytskgaz |
140 705,60 |
168 844,80 |
28 139,20 |
20,0% |
* Planned figures not adjusted for actual gas distribution volumes in 2020.
** In practice, the difference between the planned and actual figures could result from smaller or larger procurement volumes.
Mykolaivgaz JSC Chief Technology Officer Dmytro Hrytsai explains this difference by the fact that before the new Methodology was approved, PTL indicators (and, therefore, the related monetary costs) did not take into account a number of other technological loss indicators, in particular, the costs of bringing gas volumes to standard conditions.
The non-inclusion of certain costs in PTL before 2021 could probably have effect on overspending. At the same time, the coefficients (source: Energy Map) of bringing gas volumes to standard conditions could reach up to 11% depending on region and calendar month. Therefore, that cannot fully account for the difference between planned and actual gas procurement costs: at Zakarpatgaz, for example, it probably amounts to 86.4%, or UAH 133 million.
That’s why the effectiveness of PTL gas procurements by oblgaz companies remains debatable. The publicly available detailed procurement data helps assess how conformant these expenses were with market gas prices. Let’s take a closer look at this matter on the example of Mykolaivgaz.
We’ll compare the prices at which gas was procured for PTL needs with the wholesale prices calculated by the NEURC by monitoring the natural gas market (source: Energy Map). It is worth emphasizing that the energy regulator’s data is quarterly while information from inspection reports is monthly. Therefore, to ensure correct comparison the prices from inspection reports where aggregated to weighted average quarterly prices.
The inspection of Mykolaivgaz covered the period of 2018-2020. The amount spent by this DSO on PTL gas exceeds the planned costs (set into the tariff) by as much as 63.1%. In addition, the procurements by this oblgaz company contain several “interesting” features that will be revealed below.
So, the diagram below compares PTL gas procurement prices paid by Mykolaivgaz in 2018-2020 with three wholesale prices calculated by the NEURC: gas price on the Ukrainian border (including transmission costs), wholesale price from gas production companies and wholesale price in the unregulated market segment.
Mykolaivgaz was procuring gas above the market price, in certain periods by as much as 40-50%. According to our calculations, during three years this oblgaz company has probably overpaid between 255 and 332 million hryvnias, comparing these expenses with three price indicators.
In light of this information, there is a logical question: if oblgaz companies buy dear, whom do they buy from? Inspection reports provide answer to this question as well, for they contain information about gas procurements of oblgaz companies under contracts with suppliers. Let’s take another look at Mykolaivgaz’s indicators.
Mykolaivgaz’s contracts with suppliers
|
Year |
Supplier |
Start date under contract |
Gas volume, thousand m³ |
Delivery charge, UAH |
Gas price, UAH per thousand m³ |
|
2019 |
YE Energy |
26.12.2016 |
1 635,50 |
16 378 700 |
10 014,49 |
|
2019 |
YE Energy |
26.12.2016 |
325,90 |
3 287 000 |
10 085,92 |
|
2019 |
Gas TSO Ukraine |
17.12.2015 |
47 290,90 |
433 889 400 |
9 174,90 |
|
2020 |
YE Energy |
26.12.2016 |
40,70 |
240 100 |
5 899,26 |
|
2020 |
YE Energy |
27.02.2020 |
7 889,10 |
42 609 100 |
5 401,01 |
|
2020 |
YE Energy |
14.01.2020 |
2 985,00 |
17 569 800 |
5 886,03 |
|
2020 |
YE Energy |
27.01.2020 |
3 735,70 |
22 003 400 |
5 890,03 |
|
2020 |
YE Energy |
18.02.2020 |
3 550,50 |
20 869 900 |
5 878,02 |
|
2020 |
YE Energy |
26.03.2020 |
228,20 |
1 226 700 |
5 375,55 |
|
2020 |
YE Energy |
31.03.2020 |
8 767,60 |
39 229 500 |
4 474,37 |
|
2020 |
YE Energy |
16.04.2020 |
10 925,40 |
95 444 200 |
8 735,99 |
|
2020 |
Gas TSO Ukraine LLC |
04.02.2020 |
7 426,00 |
46 592 200 |
6 274,20 |
Mykolaivgaz, an RGC Group company, buys gas mostly from the affiliated company YE Energy (formerly RGC Trading). The very fact of this procurement is not something illegal – what raises questions is the price.
According to data by UEE (source: Energy Map), gas procurements in January-March 2020 were conformant with weighted average prices. However, no particular benefits for the oblgaz company could be discerned from the contract with YE Energy dated 16.04.2020: the gas price under this contract was 8736 UAH per tcm, while the weighted average price at UEE in April was 4698.41 UAH per tcm. Considering that this contract was the largest in terms of delivery volume, the approximate overpayment amount could reach UAH 44 million, or 15% of the total PTL gas procurement costs in 2020.
Another interesting feature of gas procurements by Mykolaiv oblgaz company is advance payments for gas, sometimes made for gas that was never delivered. As an example, let’s take a look at one of the gas delivery contracts made in 2020 with Mykolaivgazzbut (page 105 of the relevant inspection report).
Gas delivery contract with Mykolaivgazzbut in 2020
|
No and subject of contract |
Delivery volume, thousand m³ |
Charge, thousand UAH |
Payment for deliveries, thousand UAH |
Amount due as of the end of 2020, thousand UAH |
|
No 12S540-18635-19 of 01.11.2019 |
0 |
0 |
470 |
-470 |
In other words, Mykolaivgazzbut delivered no gas to Mykolaivgaz under this contract in 2020. It turns out that the latter paid UAH 470 thousand “for 2020 volumes” which never existed (see: “Gas volume in 2020, thousand cubic meters” column).
Similar instances took place with regard to gas procurements from YE Energy LLC.
Gas delivery contract with YE Energy LLC in 2020
|
Supplier |
No and subject of contract |
Amount due for entire period as of 1.01.2019 |
Volume in 2019, thousand m³ |
Charge for 2019, thousand UAH |
Payment for volumes of past years |
Payment for 2019 volumes |
Debt settlement level, % |
Amount due for 2019 as of the end of 2019 |
Amount due for entire period as of the end of 2019 |
|
YE Energy LLC |
No МК-02-2018-239 of 06.11.2018 |
-14 879,60 |
0 |
0 |
0 |
0 |
0% |
0 |
-14 879,60 |
|
YE Energy LLC |
No МК-ВТВ-02-2017-124 of 26.12.2016 |
-82 159,10 |
1 635,50 |
16 378,70 |
-35 100 |
0 |
53% |
16 378,70 |
-30 680,40 |
|
YE Energy LLC |
No МК-В-02-2017-104 of 26.12.2016 |
1 076,50 |
325,9 |
3 278 |
|
3 822 |
88% |
-535 |
541,5 |
Compensation to oblgaz companies for inefficiency?
As we can see, the amounts due are negative, which means that YE Energy owes to Mykolaivgaz for undelivered gas volumes, or Mykolaivgaz has paid for gas in advance and received a portion of it in 2019 at the price of 10 hryvnias per cubic meter. It is worth reminding that according to gas market monitoring data by the NEURC, the market price at that time was lower.
The aforementioned data raises a question: why buying or withdrawing more expensive gas from the gas transmission system, if there is a possibility to go to a commodity exchange or buy on Prozorro? The latter, by the way, is an obligation placed on oblgaz companies under the Public Procurement Law (Article 2 (2) (1) of the Law) and the License Terms and Conditions (Chapter 2 (2.2) (26) of the License Terms and Conditions).
Certain oblgaz companies made formal attempts to buy gas on Prozorro, but most likely, without the intention to make them successful. The main reason for believing so is the procurement payment terms: post-payment for delivered gas within 120 days. Below is the table containing a detailed description of unsuccessful (or canceled) procurements of PTL gas by oblgaz companies.
Procurements of PTL gas by oblgaz companies on Prozorro
|
Oblgaz company – procurement authority |
Planned delivery period |
Gas volume, thousand m³ |
Expected gas cost, thousand UAH with VAT |
Expected gas price, UAH per thousand m³ |
Link to procurement |
Result |
|
Dniprogaz |
01.03.2020 - 28.02.2021 |
35 199,05 |
113 047,80 |
3211,672 |
canceled |
|
|
Khmelnytskgaz |
01.03.2020 - 28.02.2021 |
38 685,00 |
172 178,81 |
4450,79 |
never held |
|
|
Khmelnytskgaz |
27.03.2020 - 28.02.2021 |
38 685,00 |
172 178,81 |
4450,79 |
never held |
On the other hand, speaking about procurements at the Ukrainian Energy Exchange, there were instances like that and the procurement prices were in line with market prices. However, it is impossible to tell which ones of them were for PTL and other needs, and therefore, we can’t determine the percentage of gas procured for PTL needs on competitive terms. A comparison of data from Mykolaivgaz inspection report and data by UEE (contract dates) suggests that only four out of the nine procurements in 2020 were done on the commodity exchange, but the data concerning volumes does not match.
It is also worth noting that the practice of buying gas on UEE took hold only in 2020, whereas the major discrepancies between actual procurement prices and market prices have occurred in 2018-2019.
Therefore, having two instruments for gas procurements on competitive terms – commodity exchange and Prozorro platform – Mykolaivgaz made direct “nontransparent” and, in our opinion, disadvantageous supply contracts.
We could assume that the reason for that is the absence of proper motivation in oblgaz companies to buy gas at market prices. As we said earlier, oblgaz companies get a portion of overspending on PTL gas resulting from the difference between the “planned” and “actual” figures compensated via tariff revenues in the subsequent years, particularly under “Compensation of expenses in past periods” item.
For a vivid example of how, when the distribution tariff was revised in April 2016, this item was formulated as “Compensation of the difference between PTL prices for 2014 and for 1Q 2015”, see: example. In total, oblgaz companies were due to receive UAH 1.36 billion in compensations from the tariff under this item.
As stated earlier, a compensation mechanism must be in place, because the prices the NEURC sets into the PTL costs are too low. But at the same time, compensation of expenses must be balanced by their effectiveness, which the regulatory authority should monitor. Read on to learn about the possible mechanisms of ensuring this effectiveness.
British experience concerning the gas distribution charge
In Britain, the national energy regulator, Ofgem, launched in 2013 a long-term model of applying the distribution charge. According to this model, the regulator not just sets a distribution tariff that covers all expenses of network operators but also creates an extensive system of requirements and benchmarks concerning the effectiveness of various aspects of their activity.
Ofgem measures the effectiveness of everything: actions taken to reduce the company’s carbon footprint (in particular, by reducing PTL), customer service, engagement by operators of various stakeholders (enterprises, consumer associations and other) into decision making process.
After making an evaluation, the regulatory agency applies incentives or penalties. The range of instruments for that purpose is quite broad: from direct financial regulation (decrease or increase of tariff revenue) to purely reputational (rating based on target indicators). At the same time, the publicity of this process is at the highest level (see: Appendix 1 – Summary of responses).
As part of this approach to regulation, they have shrinkage allowances – those very PTL costs, but their financing contains a stimulation element. The general meaning of this mechanism is to set an acceptable level of losses and spending based on their modeling data. The pricing basis to determine the cost of this gas is the price in the day-ahead market, provided by an authoritative pricing agency. If the spending and loss of gas fall below the preset target indicator, the saved money will be divided between the operator and the consumer, but if that figure is higher than the target, the operator incurs an unplanned expense not set into the tariff and which the operator will have to cover at their own expense.
At the same time, there are similar financial incentives to reduce carbon footprint from the activity of network operators.
In February 2021, Britain’s regulator, Ofgem, launched a project of technical assistance for its Ukrainian counterpart, the NEURC. Therefore, we hope that the approach to regulation of the gas distribution activity will only improve in the future.
It is worth noting that in the course of our analysis, we drew conclusions solely on the basis of publicly available data concerning performance of gas companies, which is obviously not enough. The volumes of PTL and their rationale remain a nonpublic “black box”, the key to which should be provided by detailed information about the condition of distribution networks. This way, we’ll be able to remove the veil of mystery from the gas bill and demonstrate transparency of the gas distribution tariffing process.
Andrii Ursta, writing for Ukrainian Energy
The above material was prepared thanks to the support of the American People, provided through the United States Agency for International Development (USAID) within the framework of the Energy Sector Transparency project implemented by DiXi Group.
The content of this publication is the sole responsibility of DiXi Group, and it does not necessarily reflect the views of USAID or the United States Government.